Comparison and analysis of AI models across key metrics including quality, price, performance and speed (throughput & latency), context window & others.
The Rightstack Research DB

Comparison and analysis of AI models across key metrics including quality, price, performance and speed (throughput & latency), context window & others. Click on any model to see detailed metrics. For more details including relating to our methodology, see our FAQs.
Models compared: OpenAI: GPT-3.5 Turbo, GPT-3.5 Turbo (0125), GPT-3.5 Turbo (1106), GPT-3.5 Turbo Instruct, GPT-4, GPT-4 Turbo, GPT-4 Turbo (0125), and GPT-4 Vision, Google: Gemini Pro and Gemma 7B, Meta: Code Llama (70B), Llama 2 Chat (13B), Llama 2 Chat (70B), and Llama 2 Chat (7B), Mistral: Mistral 7B, Mistral Medium, and Mixtral 8x7B, Anthropic: Claude 2.0, Claude 2.1, and Claude Instant, Cohere: Command and Command Light, Perplexity: PPLX-70B-online and PPLX-7B-Online, and OpenChat: OpenChat 3.5.
Highlights
Quality
Quality Index; Higher is better
100100776762625837GPT-4GPT-4 TurboMistral MediumClaude 2.0GPT-3.5 TurboMixtral 8x7BGemini ProLlama 2 Chat(70B)
Speed
Throughput in Tokens per Second; Higher is better
10789786929242018Mixtral 8x7BGemini ProGPT-3.5 TurboLlama 2 Chat(70B)Claude 2.0GPT-4GPT-4 TurboMistral Medium
Price
USD per 1M Tokens; Lower is better
37.515124.11.310.80.5GPT-4GPT-4 TurboClaude 2.0Mistral MediumGemini ProLlama 2 Chat(70B)GPT-3.5 TurboMixtral 8x7B37.515124.11.310.80.5
Parallel Queries:
SingleMultiple
Prompt Length:
Short
Quality comparison by ability
Varied metrics by ability categorization; Higher is better
General Ability (Chatbot Arena)
124312431150113111211117111110771023GPT-4GPT-4 TurboMistral MediumClaude 2.0Mixtral 8x7BGPT-3.5 TurboGemini ProLlama 2 Chat(70B)Mistral 7B124312431150113111211117111110771023
Reasoning & Knowledge (MMLU)
86%79%75%72%71%70%63%55%GPT-4Claude 2.0Mistral MediumGemini ProMixtral 8x7BGPT-3.5 TurboLlama 2 Chat(70B)Mistral 7BGPT-4 Turbo86%79%75%72%71%70%63%55%N/A
Reasoning & Knowledge (MT Bench)
9.38.68.48.38.16.96.8GPT-4 TurboMistral MediumGPT-3.5 TurboMixtral 8x7BClaude 2.0Llama 2 Chat(70B)Mistral 7BGPT-4Gemini Pro9.38.68.48.38.16.96.8N/AN/A
Coding (HumanEval)
88.485.473.271.263.4GPT-4GPT-4 TurboGPT-3.5 TurboClaude 2.0Gemini ProLlama 2 Chat(70B)Mistral 7BMixtral 8x7BMistral Medium88.485.473.271.263.4N/AN/AN/AN/A
OpenAI's GPT-4 is the clear quality leader across quality metrics. However, models including Gemini Pro and Mixtral 8x7B have reached GPT-3.5 performance in some measures.
Total Response Time: Time to receive a 100 token response. Estimated based on Latency (time to receive first chunk) and Throughput (tokens per second).
Median across hosts: Figures represent median (P50) across all hosts which support the model.
Quality vs. Price
Quality: General reasoning index, Price: USD per 1M Tokens
Most attractive quadrant
ArtificialAnalysis.ai$0.00$5.00$10.00$15.00$20.00$25.00$30.00$35.00$40.00$45.00Price (USD per M Tokens)0102030405060708090100110120Quality (General ability index)Mistral 7BMistral 7BLlama 2 Chat (70B)Llama 2 Chat (70B)Gemini ProGemini ProGPT-3.5 TurboGPT-3.5 TurboMixtral 8x7BMixtral 8x7BClaude 2.0Claude 2.0Mistral MediumMistral MediumGPT-4 TurboGPT-4 TurboGPT-4GPT-4
Higher quality models are typically more expensive. However, model quality varies significantly and some open source models now achieve very high quality.
Quality: Index represents normalized average relative performance across Chatbot arena, MMLU & MT-Bench.
Price: Price per token, represented as USD per million Tokens. Price is a blend of Input & Output token prices (3:1 ratio).
Median across hosts: Figures represent median (P50) across all hosts which support the model.
Pricing: Input and Output prices
USD per 1M Tokens
Input price
Output price
ArtificialAnalysis.ai301082.7510.80.50.40.156030248.24211.50.60.2GPT-4GPT-4 TurboClaude 2.0Mistral MediumGemini ProLlama 2 Chat(70B)GPT-3.5 TurboMixtral 8x7BMistral 7B301082.7510.80.50.40.156030248.24211.50.60.2
Prices vary considerably, including between input and output token price. GPT-4 stands out as orders of magnitude higher priced than most other models.
Input price: Price per token included in the request/message sent to the API, represented as USD per million Tokens.
Output price: Price per token generated by the model (received from the API), represented as USD per million Tokens.
Median across hosts: Figures represent median (P50) across all hosts which support the model.
Quality vs. Throughput, Price
Quality: General reasoning index, Throughput: Tokens per Second, Price: USD per 1M Tokens
Most attractive quadrant
Size represents Price (USD per M Tokens)
ArtificialAnalysis.ai0102030405060708090100110120Throughput (Tokens per Second)0102030405060708090100110120Quality (General ability index)Claude 2.0Claude 2.0Llama 2 Chat (70B)Llama 2 Chat (70B)Mistral MediumMistral MediumMistral 7BMistral 7BGPT-3.5 TurboGPT-3.5 TurboGPT-4 TurboGPT-4 TurboGPT-4GPT-4Gemini ProGemini ProMixtral 8x7BMixtral 8x7B
There is a trade-off between model quality and throughput, with higher quality models typically having lower throughput.
Quality: Index represents normalized average relative performance across Chatbot arena, MMLU & MT-Bench.
Throughput: Tokens per second received while the model is generating tokens (ie. after first chunk has been received from the API).
Price: Price per token, represented as USD per million Tokens. Price is a blend of Input & Output token prices (3:1 ratio).
Total Response Time
Seconds to Output 100 Tokens; Lower is better
ArtificialAnalysis.ai65.55.542.91.81.81.61.2Mistral MediumGPT-4GPT-4 TurboClaude 2.0Gemini ProGPT-3.5 TurboLlama 2 Chat(70B)Mistral 7BMixtral 8x7B
The speed difference between the fastest and slowest models is >3X. There is not always a correlation between parameter size and speed, or between price and speed.
Total Response Time: Time to receive a 100 token response. Estimated based on Latency (time to receive first chunk) and Throughput (tokens per second).
Median across hosts: Figures represent median (P50) across all hosts which support the model.
Total Response Time, Over Time
Seconds to Output 100 Tokens; Lower is better
ArtificialAnalysis.aiDec 17Dec 18Dec 19Dec 20Dec 21Dec 22Dec 23Dec 24Dec 25Dec 26Dec 27Dec 28Dec 29Dec 30Dec 31Jan 01Jan 02Jan 03Jan 04Jan 05Jan 06Jan 07Jan 08Jan 09Jan 10Jan 11Jan 12Jan 13Jan 14Jan 15Jan 16Jan 17Jan 18Jan 19Jan 20Jan 21Jan 22Jan 23Jan 24Jan 25Jan 26Jan 27Jan 28Jan 29Jan 30Jan 31Feb 01Feb 02Feb 03Feb 04Feb 05Feb 06Feb 07Feb 08Feb 09Feb 10Feb 11Feb 12Feb 13Feb 14Feb 15Feb 16Feb 17Feb 18Feb 19Feb 20Feb 21Feb 22Feb 23Feb 240s2s4s6s8s10s12s14s16s18scount
Total Response Time: Time to receive a 100 token response. Estimated based on Latency (time to receive first chunk) and Throughput (tokens per second).
Over time measurement: Median measurement per day, based on 8 measurements each day at different times.
Median across hosts: Figures represent median (P50) across all hosts which support the model.
Quality vs. Context window, Input token price
Quality: General reasoning index, Context window: Tokens limit, Input Price: USD per 1M Tokens
Most attractive quadrant
Size represents Input Price (USD per M Tokens)
ArtificialAnalysis.ai0.020k40k60k80k100k120k140kContext window (Tokens limit)0102030405060708090100110120Quality (General ability index)Llama 2 Chat (70B)Llama 2 Chat (70B)Mistral 7BMistral 7BGPT-4GPT-4GPT-3.5 TurboGPT-3.5 TurboGemini ProGemini ProMixtral 8x7BMixtral 8x7BMistral MediumMistral MediumClaude 2.0Claude 2.0GPT-4 TurboGPT-4 Turbo
Open AI's GPT-4 Turbo and Anthropic's Claude models stand out as leaders in offering large context windows. A trade off of quality and context window size exists between GPT-4 Turbo and Claude 2.1, Claude 2.1 is also marginally cheaper.
Quality: Index represents normalized average relative performance across Chatbot arena, MMLU & MT-Bench.
Context window: Maximum number of combined input & output tokens. Output tokens commonly have a significantly lower limit (varied by model).
Input price: Price per token included in the request/message sent to the API, represented as USD per million Tokens.
Context window
Context window: Tokens limit; Higher is better
ArtificialAnalysis.ai128k100k32.8k32.8k32.8k16.4k8.19k8.19k4.10kGPT-4 TurboClaude 2.0Mixtral 8x7BMistral MediumGemini ProGPT-3.5 TurboGPT-4Mistral 7BLlama 2 Chat(70B)128k100k32.8k32.8k32.8k16.4k8.19k8.19k4.10k
Open AI's GPT-4 Turbo and Anthropic's Claude models, particuarly Claude 2.1, stand out as leaders in offering large context windows.
Context window: Maximum number of combined input & output tokens. Output tokens commonly have a significantly lower limit (varied by model).
Detailed performance metrics
Latency vs. Throughput
Latency: Seconds to First Tokens Chunk Received, Throughput: Tokens per Second
Most attractive quadrant
Size represents Price (USD per M Tokens)
ArtificialAnalysis.ai0102030405060708090100110120Throughput (Tokens per Second)0s0.2s0.4s0.6s0.8s1s1.2s1.4s1.6s1.8s2s2.2s2.4sLatency (Time to First Chunk)Mistral MediumMistral MediumGPT-4 TurboGPT-4 TurboGPT-4GPT-4Claude 2.0Claude 2.0Llama 2 Chat (70B)Llama 2 Chat (70B)Mistral 7BMistral 7BGPT-3.5 TurboGPT-3.5 TurboGemini ProGemini ProMixtral 8x7BMixtral 8x7B
Throughput: Tokens per second received while the model is generating tokens (ie. after first chunk has been received from the API).
Latency: Time to first chunk of tokens received, in seconds, after API request sent.
Price: Price per token, represented as USD per million Tokens. Price is a blend of Input & Output token prices (3:1 ratio).
Median across hosts: Figures represent median (P50) across all hosts which support the model.
Latency vs. Throughput: Host & Model combinations
Latency: Seconds to First Tokens Chunk Received, Throughput: Tokens per Second
Most attractive quadrant
Size represents Price (USD per M Tokens)
GPT-3.5 Turbo (OpenAI)
GPT-3.5 Turbo (Azure)
GPT-4 Turbo (OpenAI)
GPT-4 Turbo (Azure)
ArtificialAnalysis.ai0102030405060708090100Throughput (Tokens per Second)0s0.1s0.2s0.3s0.4s0.5s0.6s0.7s0.8sLatency (Time to First Chunk)GPT-4 Turbo (Azure)GPT-4 Turbo (Azure)GPT-4 Turbo (OpenAI)GPT-4 Turbo (OpenAI)GPT-3.5 Turbo (OpenAI)GPT-3.5 Turbo (OpenAI)GPT-3.5 Turbo (Azure)GPT-3.5 Turbo (Azure)
Throughput: Tokens per second received while the model is generating tokens (ie. after first chunk has been received from the API).
Latency: Time to first chunk of tokens received, in seconds, after API request sent.
Price: Price per token, represented as USD per million Tokens. Price is a blend of Input & Output token prices (3:1 ratio).
Median across hosts: Figures represent median (P50) across all hosts which support the model.
Quality vs. Throughput: Host & Model combinations
Quality: General reasoning index, Throughput: Tokens per Second, Price: USD per 1M Tokens
Most attractive quadrant
Size represents Price (USD per M Tokens)
GPT-3.5 Turbo (OpenAI)
GPT-3.5 Turbo (Azure)
GPT-4 Turbo (OpenAI)
GPT-4 Turbo (Azure)
ArtificialAnalysis.ai0102030405060708090100Throughput (Tokens per Second)0102030405060708090100110120Quality (General ability index)GPT-3.5 Turbo (OpenAI)GPT-3.5 Turbo (OpenAI)GPT-4 Turbo (Azure)GPT-4 Turbo (Azure)GPT-4 Turbo (OpenAI)GPT-4 Turbo (OpenAI)GPT-3.5 Turbo (Azure)GPT-3.5 Turbo (Azure)
Throughput: Tokens per second received while the model is generating tokens (ie. after first chunk has been received from the API).
Latency: Time to first chunk of tokens received, in seconds, after API request sent.
Price: Price per token, represented as USD per million Tokens. Price is a blend of Input & Output token prices (3:1 ratio).
Median across hosts: Figures represent median (P50) across all hosts which support the model.
Throughput
Output Tokens per Second; Higher is better
ArtificialAnalysis.ai1078978766929242018Mixtral 8x7BGemini ProGPT-3.5 TurboMistral 7BLlama 2 Chat(70B)Claude 2.0GPT-4GPT-4 TurboMistral Medium
Throughput: Tokens per second received while the model is generating tokens (ie. after first chunk has been received from the API).
Median across hosts: Figures represent median (P50) across all hosts which support the model.
Throughput Variance
Output Tokens per Second; Results by percentile; Higher median is better
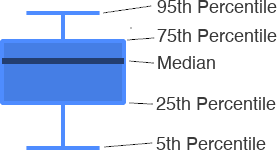
Median, Other points represent 5th, 25th, 75th, 95th Percentiles respectively
ArtificialAnalysis.aiGPT-3.5 TurboGPT-4GPT-4 TurboLlama 2 Chat(70B)Mistral 7BMixtral 8x7BMistral MediumGemini ProClaude 2.005010015020025030035040045050077.823.920.469.176.5106.917.68929.4
Throughput: Tokens per second received while the model is generating tokens (ie. after first chunk has been received from the API).
Boxplot: Shows variance of measurements
Picture of the author
Throughput, Over Time
Output Tokens per Second; Higher is better
ArtificialAnalysis.aiDec 17Dec 18Dec 19Dec 20Dec 21Dec 22Dec 23Dec 24Dec 25Dec 26Dec 27Dec 28Dec 29Dec 30Dec 31Jan 01Jan 02Jan 03Jan 04Jan 05Jan 06Jan 07Jan 08Jan 09Jan 10Jan 11Jan 12Jan 13Jan 14Jan 15Jan 16Jan 17Jan 18Jan 19Jan 20Jan 21Jan 22Jan 23Jan 24Jan 25Jan 26Jan 27Jan 28Jan 29Jan 30Jan 31Feb 01Feb 02Feb 03Feb 04Feb 05Feb 06Feb 07Feb 08Feb 09Feb 10Feb 11Feb 12Feb 13Feb 14Feb 15Feb 16Feb 17Feb 18Feb 19Feb 20Feb 21Feb 22Feb 23Feb 240102030405060708090100110120130count
Throughput: Tokens per second received while the model is generating tokens (ie. after first chunk has been received from the API).
Over time measurement: Median measurement per day, based on 8 measurements each day at different times.
Median across hosts: Figures represent median (P50) across all hosts which support the model.
Latency
Seconds to First Tokens Chunk Received; Lower is better
ArtificialAnalysis.ai20.70.60.50.50.30.30.30.3Gemini ProGPT-4Claude 2.0GPT-3.5 TurboGPT-4 TurboLlama 2 Chat(70B)Mistral 7BMixtral 8x7BMistral Medium
Latency: Time to first chunk of tokens received, in seconds, after API request sent.
Median across hosts: Figures represent median (P50) across all hosts which support the model.
Latency Variance
Seconds to First Tokens Chunk Received; Results by percentile; Lower median is better
Median, Other points represent 5th, 25th, 75th, 95th Percentiles respectively
ArtificialAnalysis.aiGPT-3.5 TurboGPT-4GPT-4 TurboLlama 2 Chat(70B)Mistral 7BMixtral 8x7BMistral MediumGemini ProClaude 2.0012345678910110.490.740.540.320.280.290.271.960.56
Latency: Time to first chunk of tokens received, in seconds, after API request sent.
Boxplot: Shows variance of measurements
Latency, Over Time
Seconds to First Tokens Chunk Received; Lower median is better
ArtificialAnalysis.aiDec 17Dec 18Dec 19Dec 20Dec 21Dec 22Dec 23Dec 24Dec 25Dec 26Dec 27Dec 28Dec 29Dec 30Dec 31Jan 01Jan 02Jan 03Jan 04Jan 05Jan 06Jan 07Jan 08Jan 09Jan 10Jan 11Jan 12Jan 13Jan 14Jan 15Jan 16Jan 17Jan 18Jan 19Jan 20Jan 21Jan 22Jan 23Jan 24Jan 25Jan 26Jan 27Jan 28Jan 29Jan 30Jan 31Feb 01Feb 02Feb 03Feb 04Feb 05Feb 06Feb 07Feb 08Feb 09Feb 10Feb 11Feb 12Feb 13Feb 14Feb 15Feb 16Feb 17Feb 18Feb 19Feb 20Feb 21Feb 22Feb 23Feb 240s1s2s3s4s5s6s7s8s9scount
Latency: Time to first chunk of tokens received, in seconds, after API request sent.
Over time measurement: Median measurement per day, based on 8 measurements each day at different times.
Median across hosts: Figures represent median (P50) across all hosts which support the model.
Further details
Model Name | Creator | License | Context Window |
Highlights
Quality
Quality Index; Higher is better
Speed
Throughput in Tokens per Second; Higher is better
Price
USD per 1M Tokens; Lower is better
Parallel Queries:
SingleMultiple
Prompt Length:
ShortLong
Total Response Time vs. Price
Total Response Time: Seconds to Output 100 Tokens, Price: USD per 1M Tokens
Most attractive quadrant
Together.ai
Anyscale
Fireworks
Price: Price per token, represented as USD per million Tokens. Price is a blend of Input & Output token prices (3:1 ratio).
Total Response Time: Time to receive a 100 token response. Estimated based on Latency (time to receive first chunk) and Throughput (tokens per second).
Median: Figures represent median (P50) measurement over the past 14 days.
Pricing: Input and Output Prices
USD per 1M Tokens; Lower is better
Input price
Output price
Input price: Price per token included in the request/message sent to the API, represented as USD per million Tokens.
Output price: Price per token generated by the model (received from the API), represented as USD per million Tokens.
Total Response Time
Seconds to Output 100 Tokens; Lower is better
Total Response Time: Time to receive a 100 token response. Estimated based on Latency (time to receive first chunk) and Throughput (tokens per second).
Median: Figures represent median (P50) measurement over the past 14 days.
Total Response Time, Over Time
Seconds to Output 100 Tokens; Lower is better
Together.ai
Anyscale
Fireworks
Total Response Time: Time to receive a 100 token response. Estimated based on Latency (time to receive first chunk) and Throughput (tokens per second).
Over time measurement: Median measurement per day, based on 8 measurements each day at different times.
Hosting Providers for Gemma 7B: Detailed performance Metrics
Latency vs. Throughput
Latency: Seconds to First Tokens Chunk Received, Throughput: Tokens per Second
Most attractive quadrant
Size represents Price (USD per M Tokens)
Together.ai
Anyscale
Fireworks
Throughput: Tokens per second received while the model is generating tokens (ie. after first chunk has been received from the API).
Latency: Time to first chunk of tokens received, in seconds, after API request sent.
Price: Price per token, represented as USD per million Tokens. Price is a blend of Input & Output token prices (3:1 ratio).
Median: Figures represent median (P50) measurement over the past 14 days.
Throughput vs. Price
Quality: General reasoning index, Throughput: Tokens per Second, Price: USD per 1M Tokens
Most attractive quadrant
Together.ai
Anyscale
Fireworks
Throughput: Tokens per second received while the model is generating tokens (ie. after first chunk has been received from the API).
Price: Price per token, represented as USD per million Tokens. Price is a blend of Input & Output token prices (3:1 ratio).
Median: Figures represent median (P50) measurement over the past 14 days.
Throughput
Output Tokens per Second; Higher is better
Throughput: Tokens per second received while the model is generating tokens (ie. after first chunk has been received from the API).
Median: Figures represent median (P50) measurement over the past 14 days.
Throughput Variance
Output Tokens per Second; Results by percentile; Higher median is better
Median, Other points represent 5th, 25th, 75th, 95th Percentiles respectively
Throughput: Tokens per second received while the model is generating tokens (ie. after first chunk has been received from the API).
Boxplot: Shows variance of measurements
Throughput, Over Time
Output Tokens per Second; Higher is better
Together.ai
Anyscale
Fireworks
Throughput: Tokens per second received while the model is generating tokens (ie. after first chunk has been received from the API).
Over time measurement: Median measurement per day, based on 8 measurements each day at different times.
Latency
Seconds to First Tokens Chunk Received; Lower is better
Latency: Time to first chunk of tokens received, in seconds, after API request sent.
Median: Figures represent median (P50) measurement over the past 14 days.
Latency Variance
Seconds to First Tokens Chunk Received; Results by percentile; Lower median is better
Median, Other points represent 5th, 25th, 75th, 95th Percentiles respectively
Latency: Time to first chunk of tokens received, in seconds, after API request sent.
Boxplot: Shows variance of measurements
Picture of the author
Latency, Over Time
Seconds to First Tokens Chunk Received; Lower is better
Together.ai
Anyscale
Fireworks
Latency: Time to first chunk of tokens received, in seconds, after API request sent.
Over time measurement: Median measurement per day, based on 8 measurements each day at different times.